@wavemaker/react-native-echarts


React Native chart components built with ECharts (via @wuba/react-native-echarts) and Skia. Works with Expo and bare React Native. Visit storybook at https://wavemaker.github.io/wm-react-native-echarts for more details on how to use and examples.
Installation
Install the package from npm:
npm install @wavemaker/react-native-echartsThe library declares peer dependencies. Add any your app does not already include (align versions with your React Native or Expo SDK):
npm install @shopify/react-native-skia @wuba/react-native-echarts echarts@6.0.0 zrender@6.0.0 react-native-svgreact and react-native are also peers; they should already be present in your app.
Note: There is an issue with echarts library. Due to which compilation fails with an error. Here is the link to the issue. https://github.com/apache/echarts/pull/20485
Till the issue is fixed, follow the workaround mentioned in the below link. https://github.com/wuba/react-native-echarts/issues/239#issuecomment-2899678660
Chart gallery
Preview thumbnails for the chart examples in assets/images/charts. Each image uses the same width and height (200×200) so the layout stays even; object-fit: contain keeps aspect ratios readable.
Area
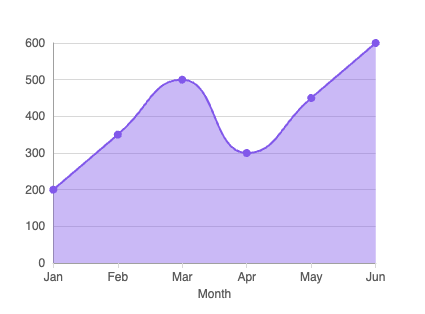
Default |
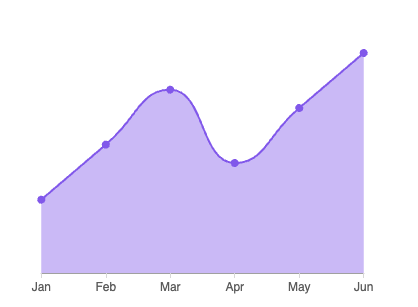 Witout axes |
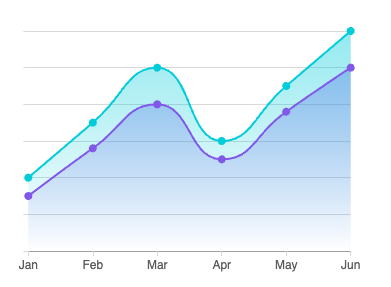 With Gradient Bg |
Bar
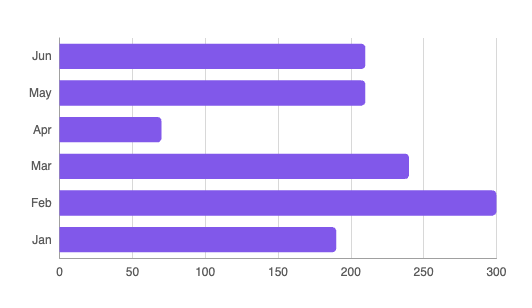 horizontal-bar |
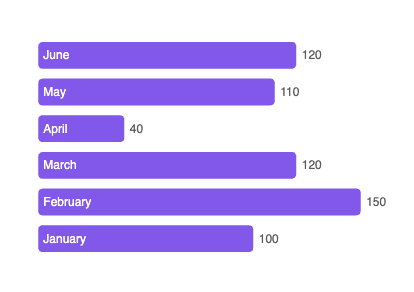 labeled-bar |
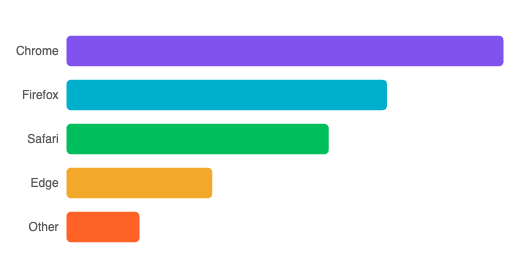 mixed-bar |
Bubble
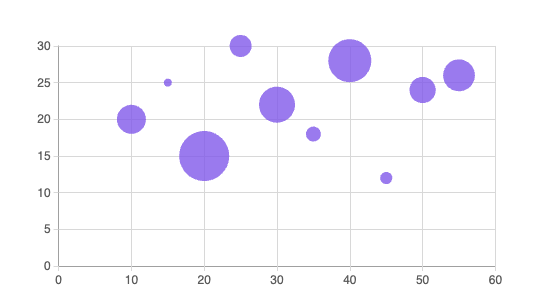 default |
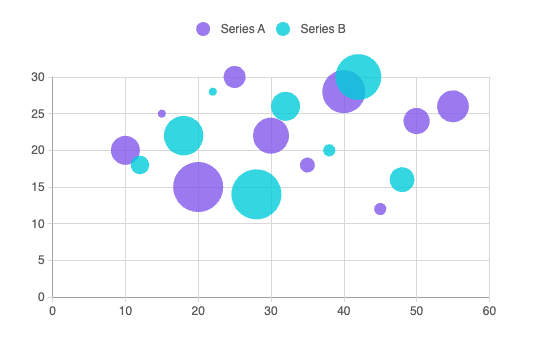 multi-bubble |
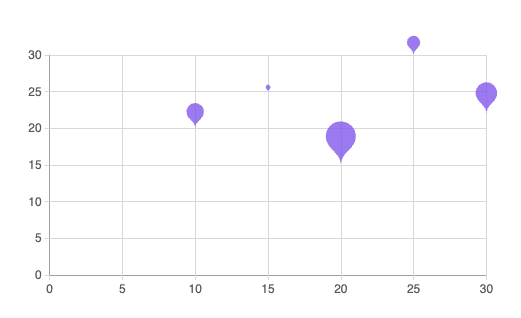 pin-bublbe |
Candlestick
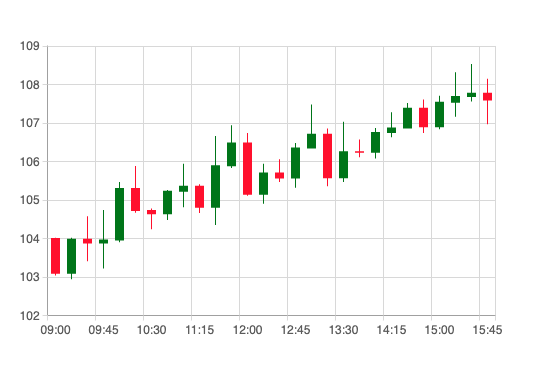 default |
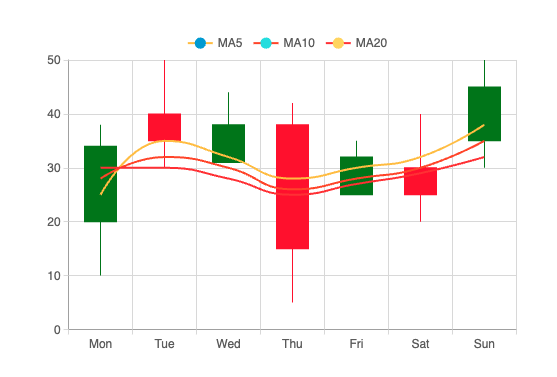 with-ma |
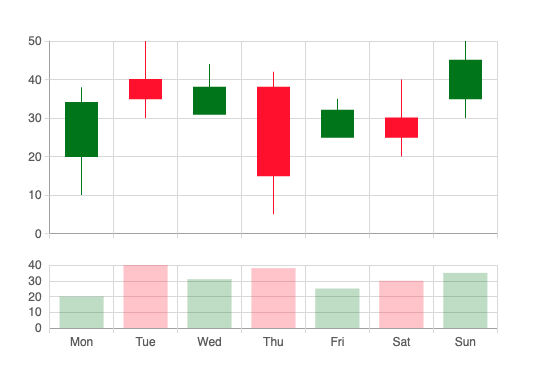 with-volume |
Column
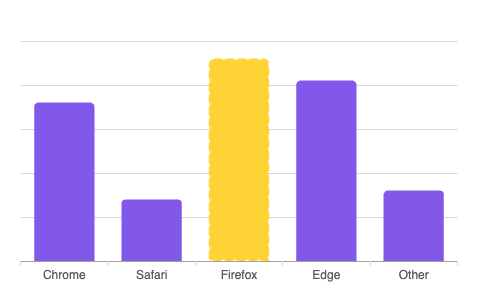 active-column |
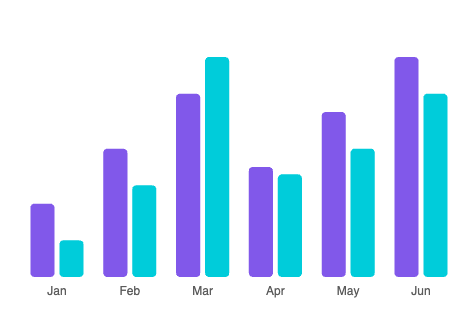 multi-series |
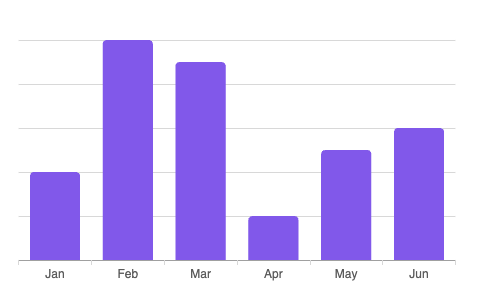 standard |
Geo
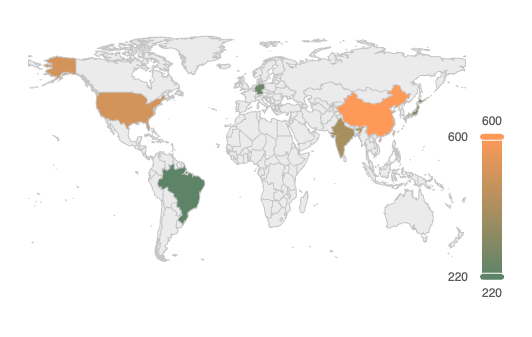 colors |
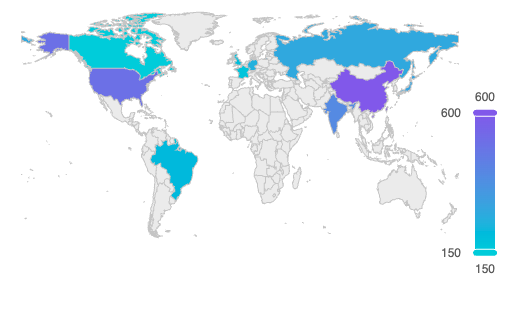 default |
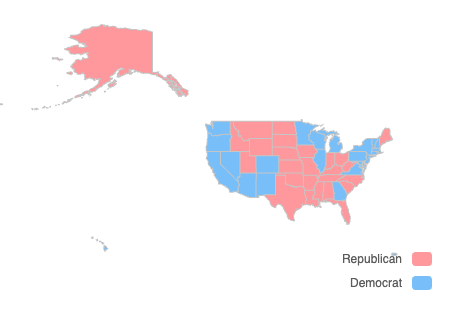 us-map |
Heatmap
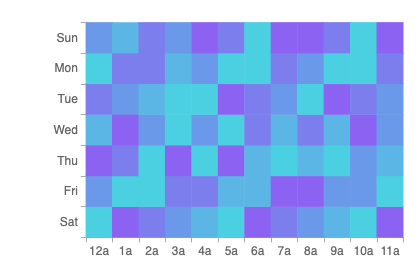 default |
 with-cell-labels |
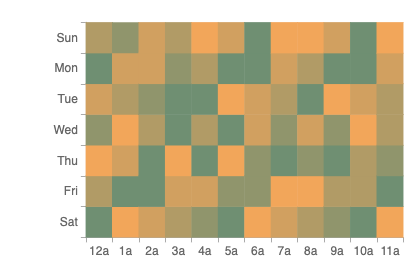 custom-colors |
Gauge
 digital |
 radial |
 simple |
Line
 multi-line |
 standard-line |
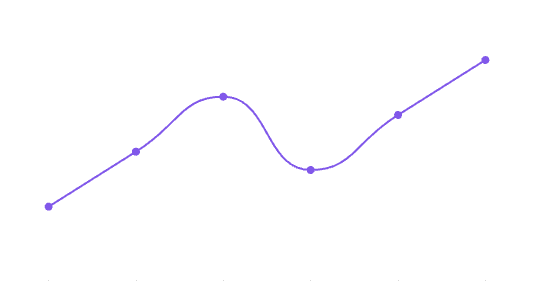 trend-line |
Pie
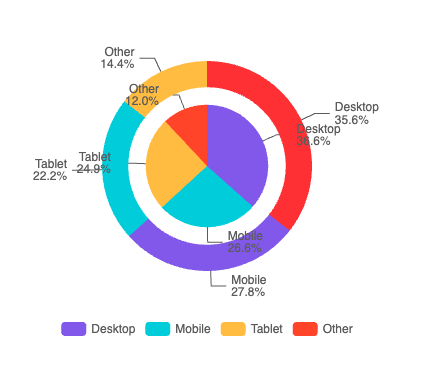 concentric |
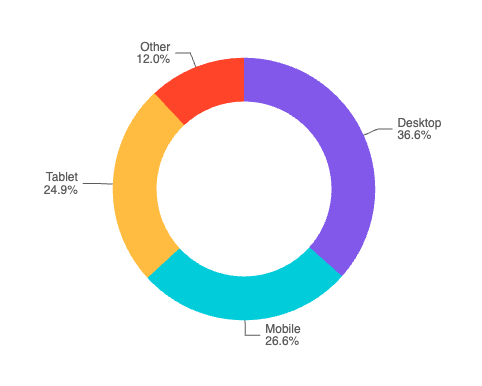 donut |
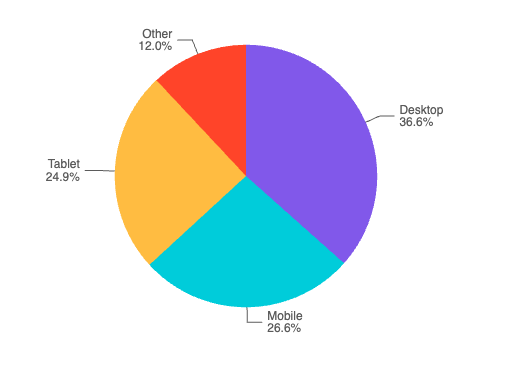 pie |
Radar
 default |
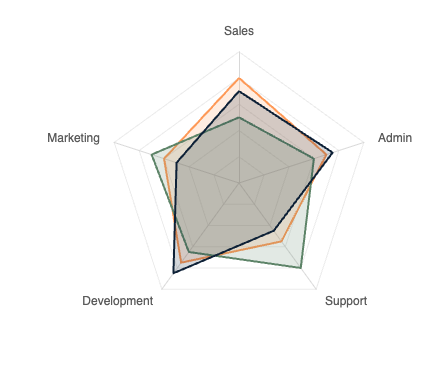 multiple |
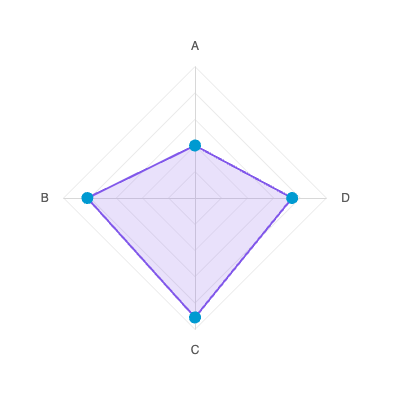 with-symbol |
Radial
 custom-colors |
 default |
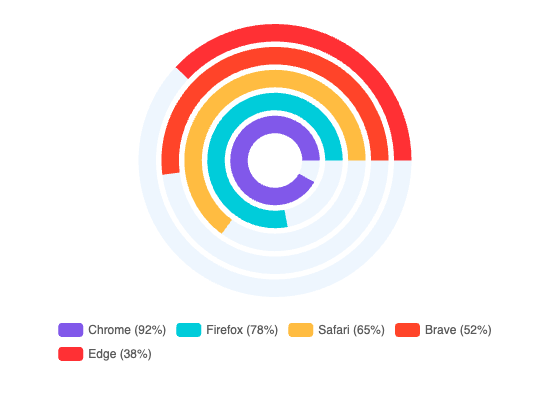 with-bg |
Scatter
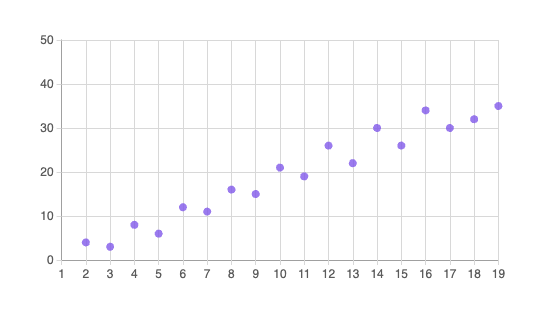 default |
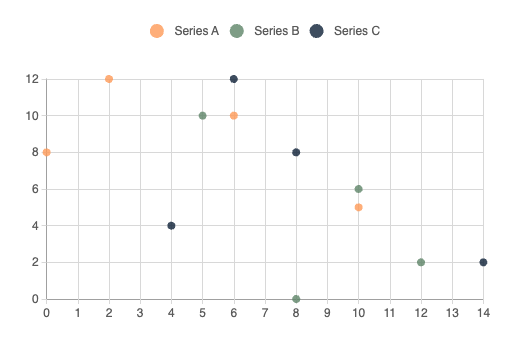 multi |
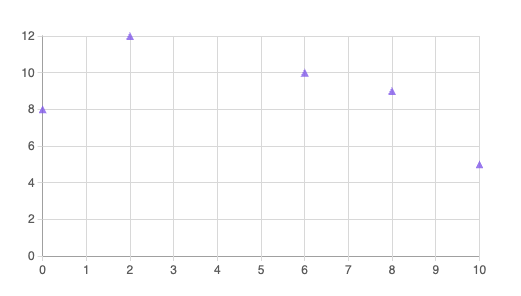 with-symbol |
Building the library (maintainers)
Compile components and prepare the npm package:
npm run build:lib      # TypeScript compile → dist/npm-packages/charts
npm run prepare:npm    # Write package.json, copy README, .npmignore
cd dist/npm-packages/charts && npm publish
Development
Work from the repository root (the directory that contains package.json, components/, and stories/).
Browser (Storybook)
Storybook runs the chart stories in the browser with Vite. After install, it serves at http://localhost:6006.
npm install
npm run storybook
Mobile (Expo sample app)
The expo-app/ project is a small Expo Router app that consumes the library via yalc. Install yalc globally first so those commands are on your PATH.
npm install -g yalc
cd /path/to/repo # repository root directory
npm install
npm run generate:package
cd expo-app
npm install
npx expo start
Whenever you change library source under components/ or related entry points, run npm run generate:package again from the repo root so the yalc-linked package is rebuilt and republished. When changes are not reflecting in the app even after reload, use npx expo start -c.
Maintainers
This package is maintained by WaveMaker. The source repository is wavemaker/wm-react-native-echarts. Use GitHub Issues for bug reports and feature requests.
Contributors
 sboyina |
License
MIT